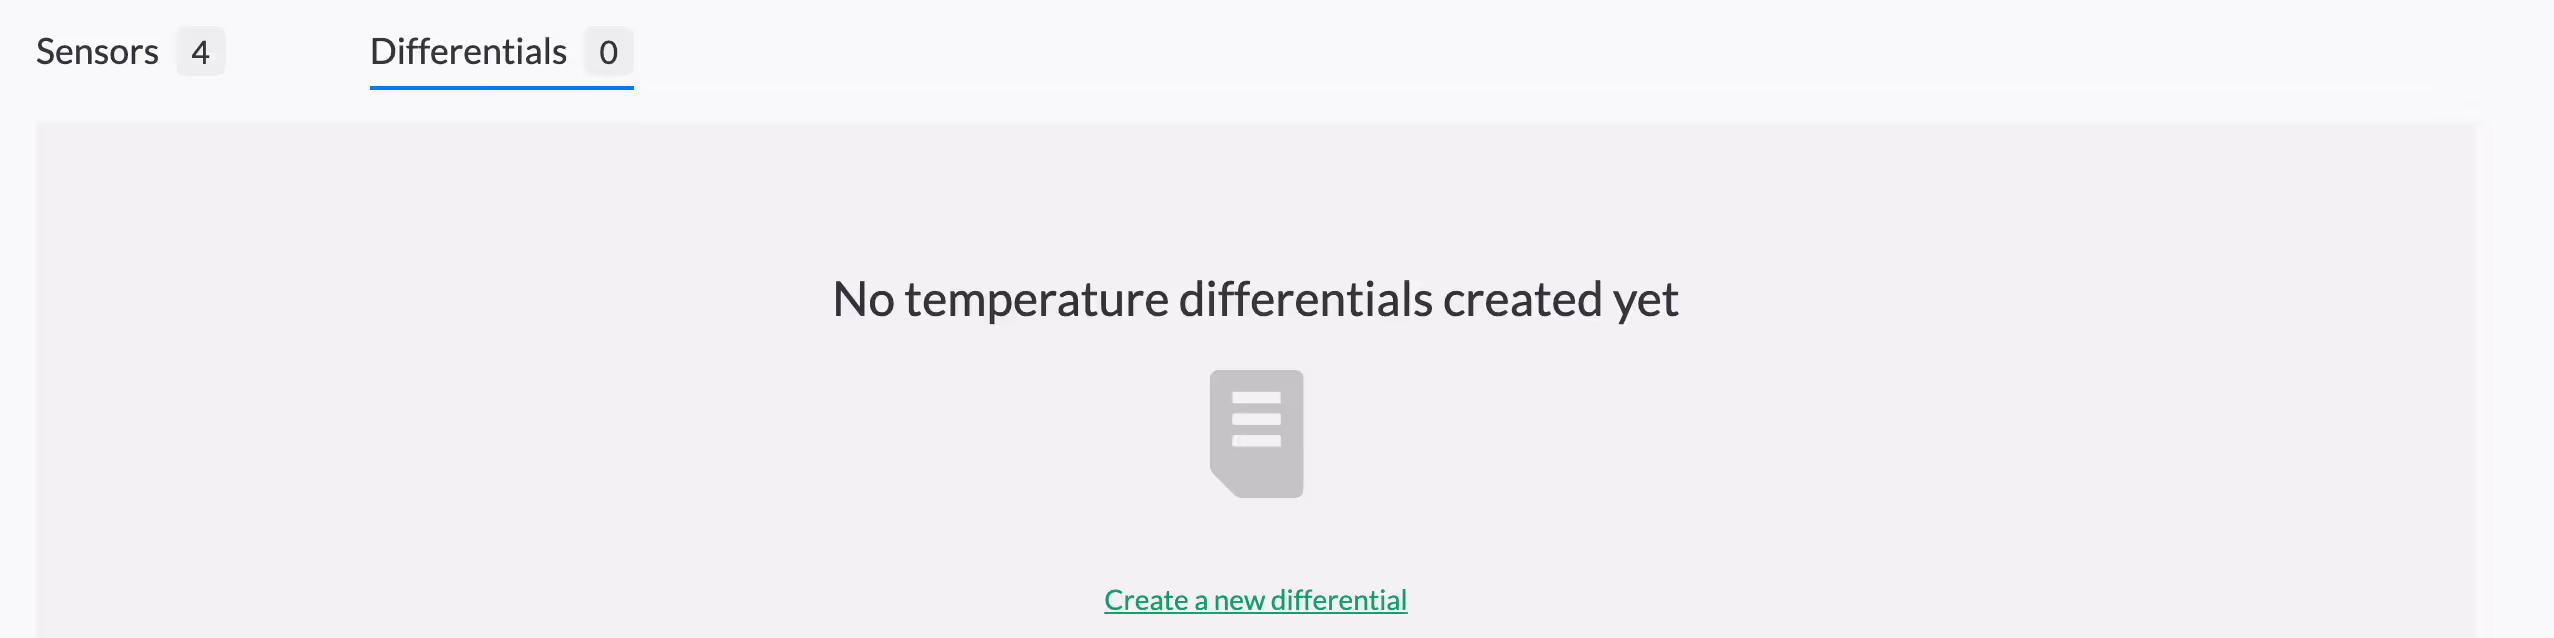
You can monitor the temperature differential between two or more sensors in a pour. To do this click on the individual pour page and open the second tab 'differentials'
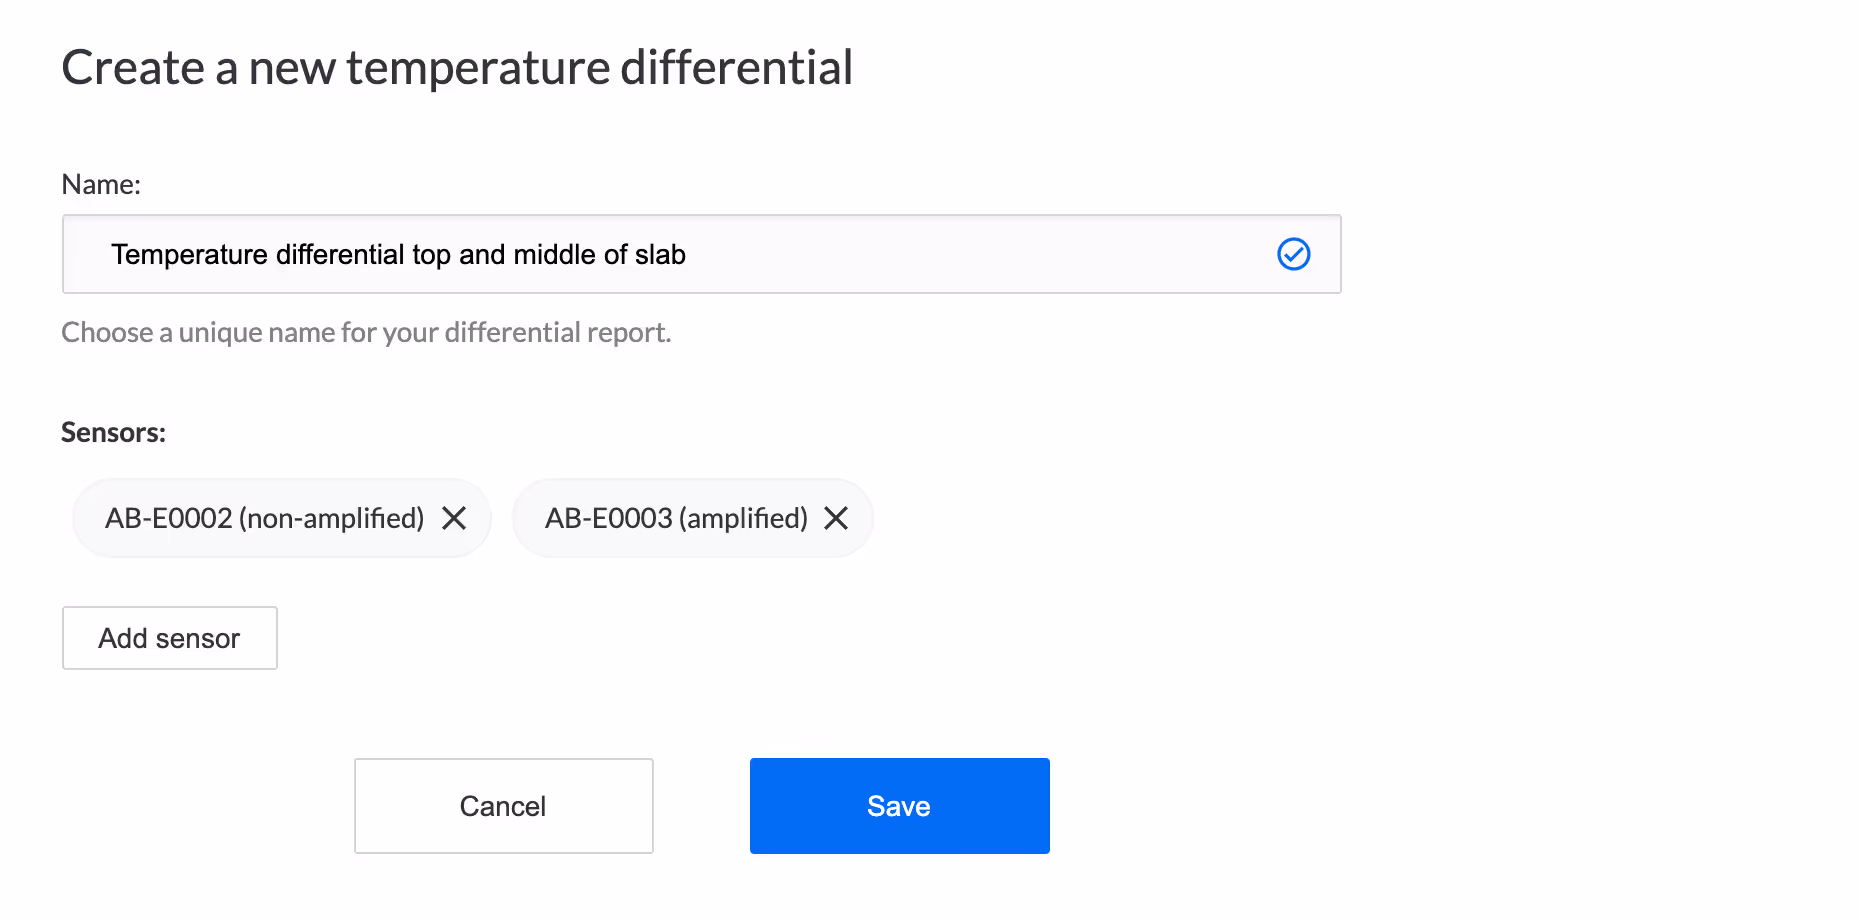
Click 'create a new temperature differential'. The next page will show you all the sensors in this pour. Give the differential you are creating a name to suit the data shown and delete any sensors you do not want to monitor. Click save and the graph is generated.
To read the graph you can filter by 'all sensors' or 'maximum temperature differential' and time period.
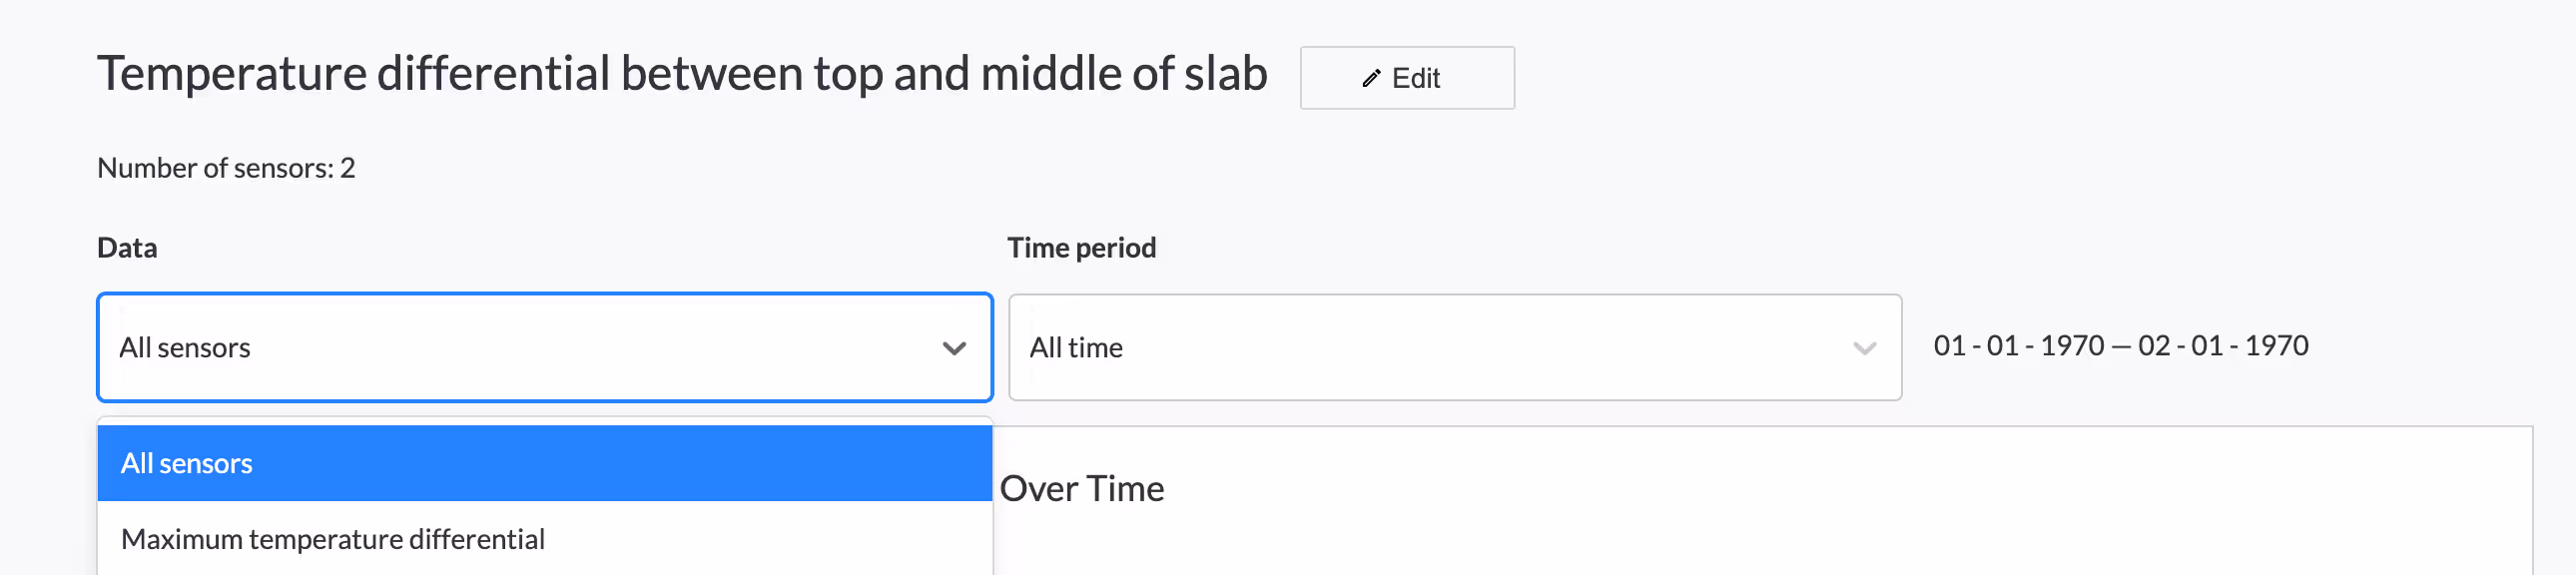
The report allows you to monitor the maximum difference between any two sensors, along with the maximum and minimum temperatures. This real-time data helps your project stay within specification and keeps a record that can be shared with designers and clients.
It is possible to download the data or print a differential report to simplify reporting and Quality assurance.
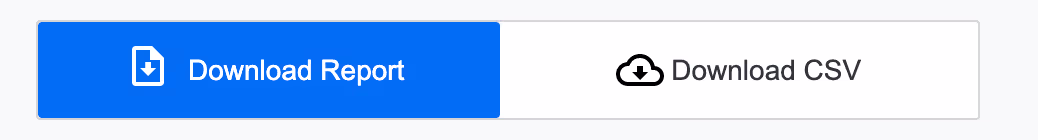
After you press the "Download CSV" option you will automatically download two files:
- XXXX-raw temperature-data.csv
- XXXX-maximum-differential.csv
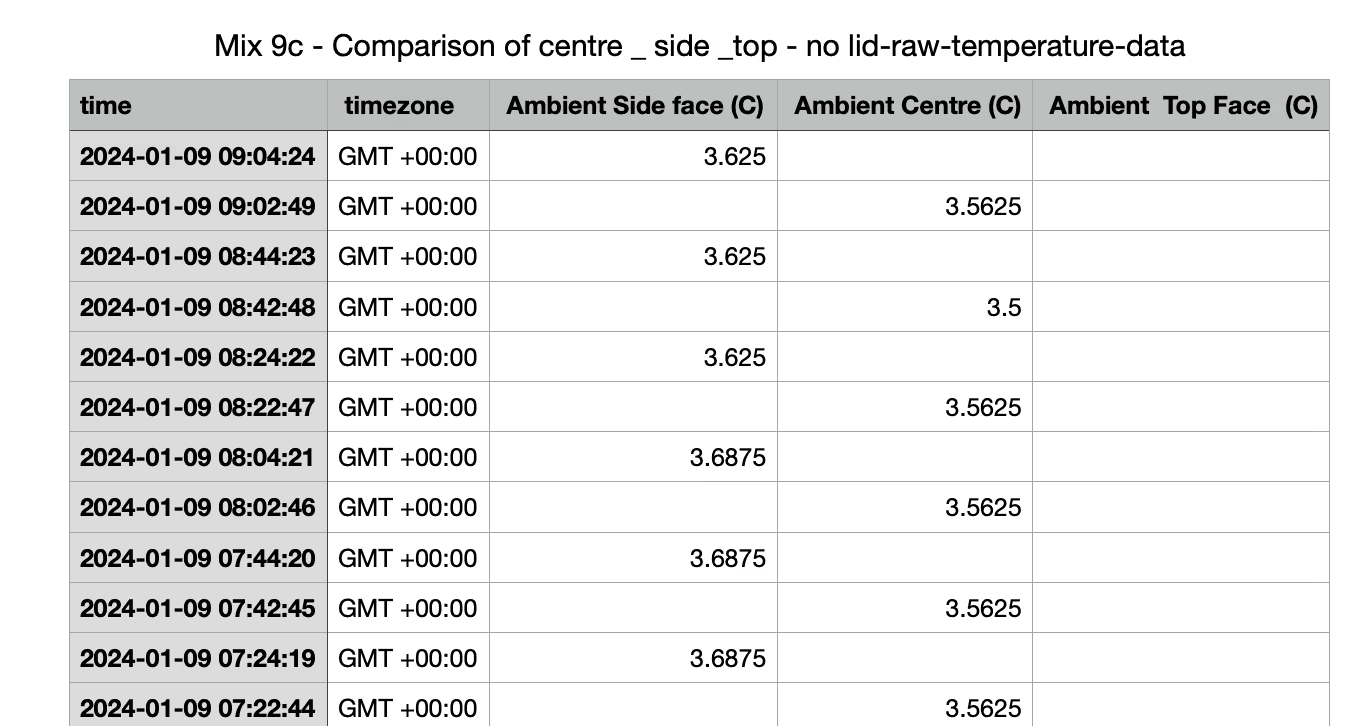
Raw temperature-data.csv
After you press the "Download CSV" option and open the file you are presented with the first and second columns which detail the times and timezone of each data packet included. Subsequent columns detail the raw temperature packets for each monitoring point. These data points are recorded at 20 minute intervals and the timestamp will likely differ from sensor to sensor.
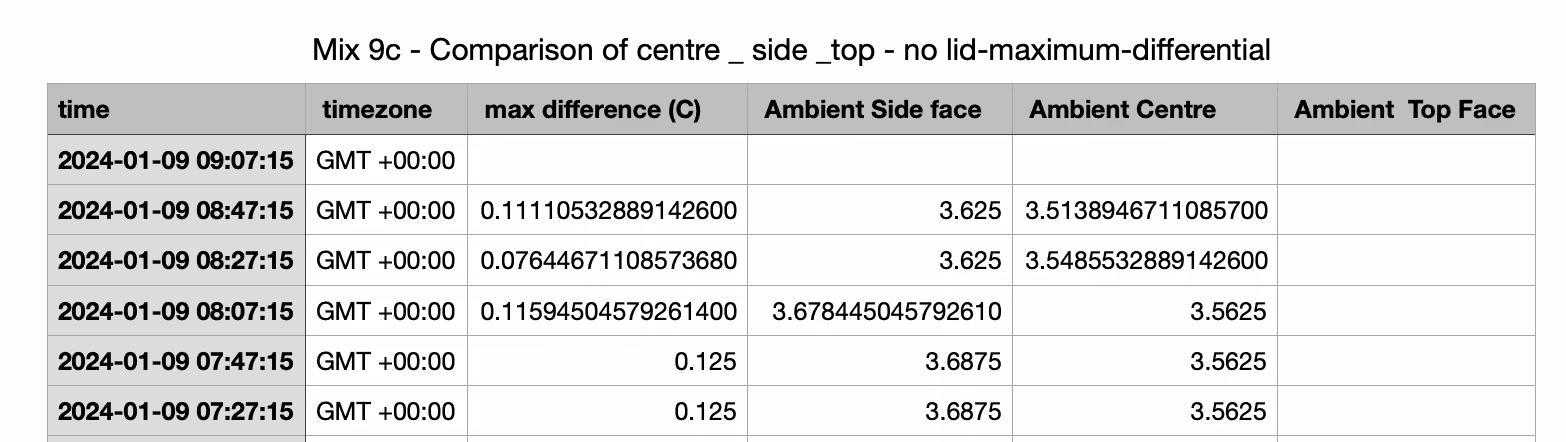
Maximum-differential.csv
After you press the "Download CSV" option and open the file you are presented with the full time period inclusive of all monitoring points - it's possible some of these monitoring points start earlier / finish later than the rest.
What Does each column show?
The first and second columns detail the times and timezone that each subsequent column will adhere.The third column shows the max difference between all monitoring points included in the row. Any subsequent columns will detail the averaged temperature of the labeled monitoring point at that time.